Kaggle Second Annual Data Science Bowl
Project Description
This project involved to predict the heart failure using Medical MRI Images. This is very challenge and using deep learning to analysis 1140 patient dataset to calculate the ejection function (EF percentage). The datasets contain SAX-AXIS, four chamber view, three chamber view and two chamber view of heart. The cardiac function is measure by end-systolic and end-diastolic which means the size of the chamber of heart at the beginning and middle of each heartbeat. The final result should contain all patient 1140 dataset with separate volume of chamber in ml probability is calculated for all systolic and diastolic for all patients.
GitHub Repo
You will clone this Repo and play with the dataset.
$ git clone https://github.com/balajincse/Kaggle-Second-Annual-Data-Science-Bowl.git
Dependencies
This implementation was written in Python 2.7.10 and relies on the following libraries:
pip install pydicom
Loading datasets
The competition dataset consists of over 1,000 complete cardiac MRI series. These come with a two chamber view, a four chamber view, and a series of longitudinal slices perpendicular to the heart’s long axis known as the short-axis stack. For this tutorial we will only be using the short-axis stack.
The dataset is organized in a very regular manner. The top-level directory consists of a number of subdirectories, one for each patient. Inside each is a single folder, named “study”, that in turn contains all of the available views for that MRI study. In particular, there’s one two chamber view (prefixed with 2ch), one four chamber view (prefixed with 4ch), and a number of short-axis views comprising a short-axis stack (prefixed with sax). These do not follow a strict incremental scheme, but you can assume that their numerical ordering matches their spatial ordering, and that sequentially adjacent slices are equidistant throughout.
The top-level method auto_segment_all_datasets() is responsible for running the algorithm on all of the datasets, and it looks like this:
def auto_segment_all_datasets():
    d = sys.argv[1]
    studies = next(os.walk(os.path.join(d, "train")))[1] + next(
        os.walk(os.path.join(d, "validate")))[1]

    labels = np.loadtxt(os.path.join(d, "train.csv"), delimiter=",",
                        skiprows=1)

    label_map = {}
    for l in labels:
        label_map[l[0]] = (l[2], l[1])

    num_samples = None
    if len(sys.argv) > 2:
        num_samples = int(sys.argv[2])
        studies = random.sample(studies, num_samples)
    if os.path.exists("output"):
        shutil.rmtree("output")
    os.mkdir("output")

    accuracy_csv = open("accuracy.csv", "w")
    accuracy_csv.write("Dataset,Actual EDV,Actual ESV,Predicted EDV,"
                       "Predicted ESV\n")
    submit_csv = open("submit.csv", "w")
    submit_csv.write("Id,")
    for i in range(0, 600):
        submit_csv.write("P%d" % i)
        if i != 599:
            submit_csv.write(",")
        else:
            submit_csv.write("\n")

    for s in studies:
        if int(s) <= 500:
            full_path = os.path.join(d, "train", s)
        else:
            full_path = os.path.join(d, "validate", s)

        dset = Dataset(full_path, s)
        print "Processing dataset %s..." % dset.name
        p_edv = 0
        p_esv = 0
        try:
            dset.load()
            segment_dataset(dset)
            if dset.edv >= 600 or dset.esv >= 600:
                raise Exception("Prediction too large")
            p_edv = dset.edv
            p_esv = dset.esv
        except Exception as e:
            log("***ERROR***: Exception %s thrown by dataset %s" % (str(e), dset.name), 0)
        submit_csv.write("%d_systolic," % int(dset.name))
        for i in range(0, 600):
            if i < p_esv:
                submit_csv.write("0.0")
            else:
                submit_csv.write("1.0")
            if i == 599:
                submit_csv.write("\n")
            else:
                submit_csv.write(",")
        submit_csv.write("%d_diastolic," % int(dset.name))
        for i in range(0, 600):
            if i < p_edv:
                submit_csv.write("0.0")
            else:
                submit_csv.write("1.0")
            if i == 599:
                submit_csv.write("\n")
            else:
                submit_csv.write(",")
        (edv, esv) = label_map.get(int(dset.name), (None, None))
        if edv is not None:
            accuracy_csv.write("%s,%f,%f,%f,%f\n" % (dset.name, edv, esv, p_edv, p_esv))

    accuracy_csv.close()
    submit_csv.close()
This function relies on the dataset directory given to the program on the command line, and searches it for subdirectories containing the studies. For example, a typical invocation (on the command line) might look like this, assuming you’re running the script in the same directory as the top-level competition data folder:
$ python segment.py .
In addition, an optional argument can be supplied after the file. If supplied, this numerical argument indicates the size of a random sample to take from the dataset. At roughly 30 seconds per study, it takes several hours to run it on the full datasets; if you’re just playing around with it, this is a good alternative to waiting around for the whole thing to finish:
$ python segment.py . 20
The above example chooses 20 of the studies at random and runs only those. The names of the studies in the output folder match those in the original dataset, so you can cross-reference them.
Images
The following Images show the output of the analysis. You have seen two types images one slice_color is an actual heart function image with pink marks on ejection flame and another one is slice_mask blue image with a dark red spot will be the clear cut of the ejection volume.
The following imgaes from 501/time00 slice with 30 images.
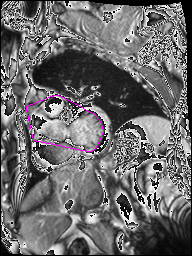

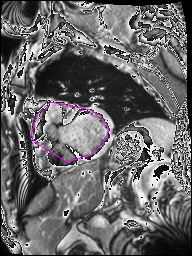

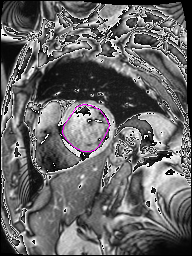

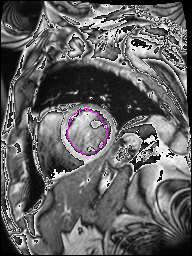

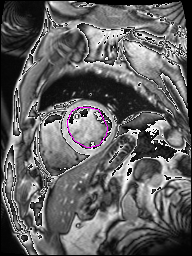

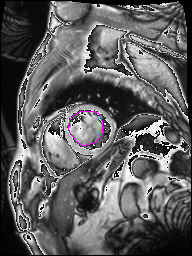

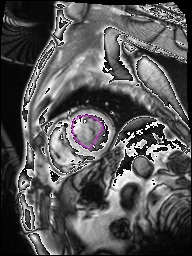

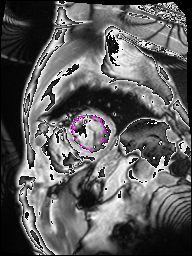

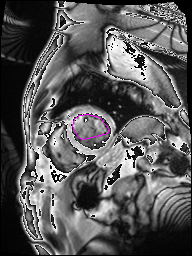

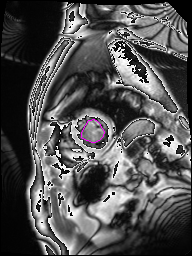

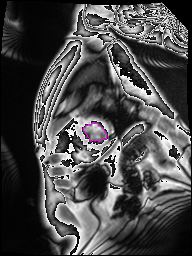

The Above show the slice of 501 patient time00 slice of heart EJ you will also get for 501 patient time00 slice to time29 slice and finally the ejection function value is written in output. Jason. This process is repeated for all the patients 100 to 1100 points you will get the above analysis images and value of EJ. Finally the Submission.csv will created.
Responsibilities
- Responsibilities first read the .DICOM image python using PYDICOM package. The SAX .DICOM images is used for analysis
- First the image get auto segment for load all images from train, validate and validate, test.
- Using the label mapping using train.csv for train, validate and validate.csv for validate, test datasets.
- The images are get sliced and for each image the volume of the chamber is calculated by ROI and the Fourier series is applied all the slices.
- The volume of the chamber is calculated separately for systolic and diastolic. Then the solution submission.csv will contain all the patient systolic and diastolic volume probability value for 0ml to 599ml for all patient systolic and diastolic.
- Organizing and coordinating the project development.
Achievement
Achieved KAGGLER position in Kaggle and successfully submitted my solution in Second Annul Data Science Bowl 2015 competition.
Link
Check out my profile Kaggle.
Environment
Python, Deep Learning, Neural Network, Medical Images, MRI Images, OpenCV, DICOM, NUMPY, SCIPY, Fourier series, SOFTMAX function, ejection function, chamber views, Anaconda python.
Check out the for more info on how to get the most out of Balaji N. File all bugs/feature requests at BalajiN GitHub repo. If you have questions, you can ask me Balaji Talk.